

Examining tissue samples under a microscope is pivotal in modern medicine for diagnosis, molecular profiling, guiding therapy and assessing treatment response. The advent of digitized images in histopathology has transformed traditional light microscopy examination into what is now termed digital pathology.1,2 Digital pathology, facilitated by the introduction of whole slide imaging (WSI) technology, has garnered significant attention from pathologists and clinicians and is rapidly becoming a standard practice.3–6 Digital pathology encompasses digital or computer-assisted platforms for the acquisition, management, sharing and interpretation of histopathology information within a digital environment. Digital slides are generated by scanning glass slides with a scanning device to produce high-resolution images accessible on computer screens or mobile devices. Current imaging tools can scan both chemically stained tissue from glass slides or deparaffinized, unstained tissue sections visualized through second harmonic generation (SHG) imaging.7 Independent of the scanning technique, pixel-level data are acquired to reconstruct histological images.
With the advent of WSI, digital pathology presents one of the most promising avenues for diagnostic medicine. It aims at providing faster, more efficient and accurate diagnoses, prognoses and predictions of cancer and other diseases. It is robust, quantitative and its outputs can be integrated with various clinical data sets.
The advances in computing capabilities along with the growing volumes of data across all aspects of life have paved the way for the increasing adoption of artificial intelligence (AI). AI is defined as a computer system’s ability to perform tasks that typically require human intelligence.8 Machine learning (ML), is a subset of AI based on pattern recognition and computational statistics, and the models’ accuracy improves with experience. Broadly, ML is categorized into unsupervised and supervised learnings.8 Unsupervised learning uses deep neural networks to analyze and cluster unlabeled data sets. These algorithms discover hidden patterns in data without the need for human intervention. Supervised learning is an ML approach which uses annotated, labeled data sets. These data sets are designed to train or ‘supervise’ algorithms into classifying data or predicting outcomes accurately. AI/ML identifies patterns, makes predictions and uncovers insights from large data sets that may be overlooked or undetected by an experienced human professional.
Integrating AI with digital pathology can provide insights into receptor-ligand binding and quantifying immune cells. AI-based approaches may find applications in translational medicine and clinical practice by predicting gene mutations from routine histopathology slides.9 AI may facilitate the identification of novel morphological and immunohistochemical biomarkers in larger cohorts or clinical trials enhancing the quantification of tumor features and its microenvironment, such as, for instance, tumor infiltrating lymphocytes, macrophages, fibroblasts or vessels, and more precise analyses of immunohistochemical biomarkers.10,11 AI has proved useful in evaluating genomic instability and mutational landscapes, enabling the assessment of pathologic and genomic features concurrently.12 The advancements in digital pathology markedly extend the information obtained from traditional pathology. As a result of the improved sensitivity, precision and standardization, it increases the capability for remote review by multiple pathologists and the handling of large and complex data sets. Thus increasing the information and utility of pathology examinations.9,13,14
This review describes the principles and applications of SHG microscopy integrated with AI, highlighting its specific benefits for the precise and granular evaluation of fibrosis. It provides an overview of how SHG digital pathology reveals new insights into fibrosis progression and regression, identifies mechanisms of action in response to therapeutic interventions. It also provides new parameters as predictors of prognosis and clinical outcomes as well as more sensitive assessment of treatment response. Additionally, it offers a perspective on future developments in integrating various technologies into a comprehensive diagnostic workflow to evaluate therapy and disease prognosis more effectively.
Fibrosis: a common response to tissue injury and principal determinant of clinical outcomes
Fibrosis represents a highly conserved and coordinated protective response to tissue injury.15 Fibrosis assessment in chronic diseases is central in diagnostic pathology and has a key role in evaluating treatment response and prognosis.8,16
The liver serves as a prototype model for studying inflammation and repair, illustrating the intricate interactions among the inflammatory, myofibroblast and extracellular matrix (ECM) components inherent in the mammalian wound-healing response. Fibrosis is almost invariably preceded by inflammation and has crucial regulatory roles of both innate and adaptive immune systems.17 Commonly, a consequence of prolonged liver damage from various insults and inflammation, liver fibrosis exhibits distinct patterns that can progress to cirrhosis, depending on the underlying etiology.18 Contrary to the historical view of fibrosis as a passive and irreversible process, the potential for fibrosis regression has been established particularly in patients where the cause of the disease or pathogenic driver is eliminated or controlled by therapy.19,20 Examples include patients cured of hepatitis C virus infection, drug-induced suppression of hepatitis B virus replication, autoimmune hepatitis under effective immunosuppression or post-surgical biliary decompression in secondary biliary fibrosis.17,21
The severity of hepatic fibrosis is the strongest predictor of clinical outcomes in chronic liver diseases, especially in metabolic dysfunction-associated steatohepatitis (MASH). Current research efforts are focused on identifying new therapies that improve fibrosis and resolve or mitigate the underlying mechanisms of MASH. Among the histologic characteristics of MASH, fibrosis stands out as the sole and most important feature correlating with clinical outcomes.22–24
To improve the quantitative assessment of fibrosis in liver biopsies, several platforms, using supervised or unsupervised ML approaches have been developed. These technologies enable precise quantification of not only the extent of scarring but also structural features of the ECM indicative of progression or regression.25–29 SHG microscopy combined with AI analysis offers several advantages for fibrosis quantitation. While most digital pathology/AI approaches rely on WSI of chemically stained samples, which introduces the challenge of staining variability, utilizing AI with SHG images of unstained samples facilitates the optimization of histological tissue assessment.30
SHG microscopy: principles for fibrosis detection in general
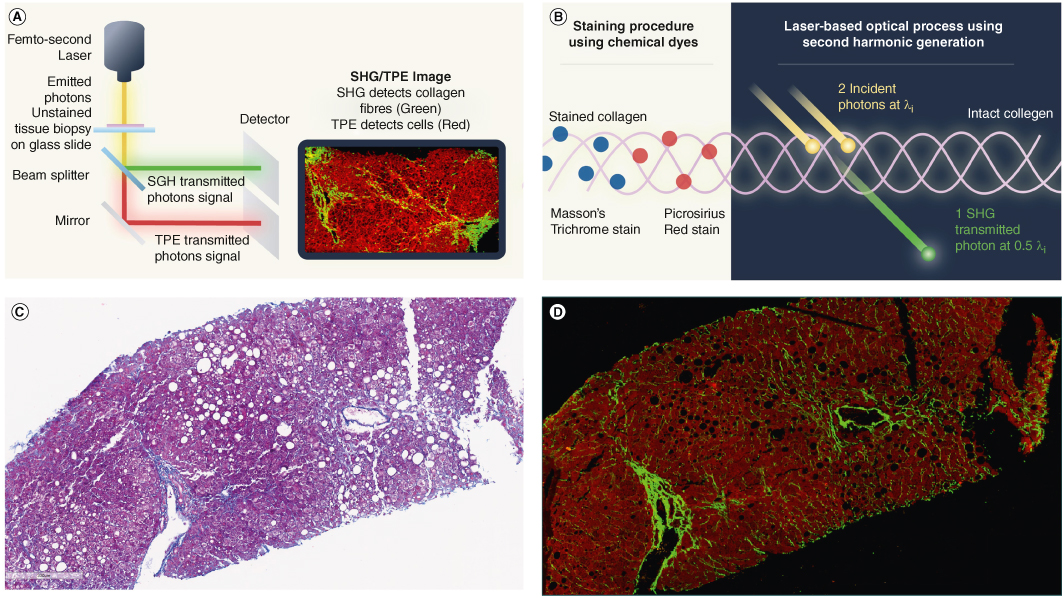
In SHG, two photons interacting with a non-centrosymmetric structure combine to generate a new photon with exactly half the wavelength. This process underlies a nonlinear optical microscopy approach, which combines SHG images of collagen with two photon excitation fluorescence (TPEF) imaging of cells to produce digital images (Figure 1). Since SHG signal generation is based on molecular structure rather than dye binding, it circumvents issues related to staining variability and photobleaching.

Biological SHG imaging was first reported in 1986 by Freund, who studied the polarity of collagen fibers in rat tail tendons at a resolution of approximately 50 μm.31 In 2002, Mohler and Campagnola reported the practical implementation of tissue imaging at high resolution and rapid data acquisition using laser scanning, and since then, SHG microscopy has been an increasingly used imaging tool.32 The unique triple-helix structure of collagen makes it exceptionally efficient in generating the second harmonic of incident light. In particular, it provides sensitive and high-resolution information on collagen distribution, discriminates between type I and type III collagen and one of the first study with SHG application on human liver tissue highlighted that its use provides greater understanding of liver cirrhosis.33 Along with SHG, third harmonic generation (THG) and multiphoton excitation are being developed for basic science research as well as for potential diagnostic applications in clinical settings, offering submicron resolution that exceeds the capabilities of conventional tomographic modalities such as computed tomography, magnetic resonance imaging and positron emission tomography, which are limited to resolutions around 1 mm.34
SHG microscopy enables quantitative collagen measurement in various organs with detailed information about fibrosis development.35–38 As illustrated in Figure 1C, SHG/TPEF provides a more sensitive and reproducible tool for collagen characterization in liver tissue than traditional staining methods like Masson’s trichrome or Picrosirius red.38 In a recent exploratory study, an AI tool for quantifying liver scarring in sections of picrosirius red-stained liver was compared with manual scoring using widely available color space thresholding and SHG imaging, a stain-free quantitative measure of collagen.39 The AI approach modestly outperformed morphometry with collagen proportionate area (CPA) measurement, highlighting the significant impact of staining variability on quantification, while the stain-free measurement with SHG was found to deliver a more accurate detection of minor scarring changes, beneficial for therapeutic trials.39
A key advantage of SHG microscopy is in its ability to directly visualize tissue structures through endogenous contrast, avoiding the limitations of exogenous dyes. SHG signals, generated from induced polarization rather than absorption, significantly reduce photobleaching and phototoxicity compared with fluorescence methods (including multiphoton). With fundamental laser wavelengths typically in the near-infrared range (700–1000 nm), SHG microscopy achieves high-resolution imaging up to several hundred microns deep without sample deterioration or photodamage.34 This feature facilitates its application in pathology after SHG scanning, accommodating both frozen and paraffin-embedded tissues and simplifies the standardization of measurements.40 Optical harmonic generation microscopies have emerged as powerful imaging modalities to examine structural properties of a wide range of biological tissues. The instrumentation used for these modalities, as well as the underlying theoretical principles of SHG and THG microscopies, and how these can extract unique structural information have been comprehensively outlined in literature.41
SHG microscopy’s potential for medical applications lies in its capability to image and characterize fibrosis in different organs such as the kidneys, liver and lungs, where increased fibrillar collagen density, associated with chronic diseases like diabetes, hepatitis, etc., correlates with poor prognoses.34 Importantly, the technique’s capacity for acquiring 3D tissue images enables more comprehensive data collection than traditional histologic sections. Furthermore, SHG microscopy surpasses conventional histological imaging by allowing the monitoring of collagen formation and re-modeling at early fibrosis stages. This capability facilitates the differentiation between distributed and aggregated collagens fibers, essential for detecting subtle pathological changes.38
SHG evaluation of liver fibrosis
Development of qFibrosis® for quantitative analyses of liver fibrosis
Leveraging the principles of SHG microscopy, a highly sensitive system for quantifying liver fibrosis was developed, focusing on the measurement of collagen fibrillar properties.25,35,38,42,43 Briefly, liver sections are de-paraffinized, and tissue scanning is performed using Genesis® 200, a fully automated, stain-free multiphoton fluorescence imaging microscope. For image acquisition, samples are laser-excited at 780 nm, SHG signals are recorded at 390 nm and TPEF signals were recorded at 550 nm. The TPEF signal is recorded to visualize the cellular components in liver tissue, thus providing valuable information on steatosis (fat accumulation within hepatocytes), inflammation and the presence of ballooned hepatocytes. Multiple adjacent image tiles are captured to encompass the entire tissue area on each slide. An AI algorithm was developed for image quantification analysis of collagen fiber characteristics within operator-defined regions of the liver samples.40,42 These regions encompass the entire liver section and five regions of the liver lobule: portal tract (PT), peri-portal, defined as the area 100 µm circumferentially around the PT (peri-PT); perisinusoidal area or Zone 2; peri-central area, 100 µm circumferentially around the central vein (CV) - peri-CV; and central vein. A comprehensive set of 184 collagen parameters are quantified within these regions.27,43,44 Sequential feature selection was used for parameter selection and a linear regression method was used to construct an overall index (qFibrosis®). This index reflects a composite score across different regions, yielding a qFibrosis® score along a continuous scale with an expanded dynamic range. The repeatability and reproducibility of this approach was shown to be 86–89%.45
An alternative approach for liver fibrosis quantification has been experimented using TPEF liver surface imaging on a rat model with a gradient-based bag-of-features image classification strategy.46 The precision and validity of this approach however has not been evaluated in clinical studies. The current manuscript includes data obtained with the established approach, with combined recording of both SHG and TPEF signals, which provides comprehensive assessment of liver structures – for fibrosis and the cellular components, respectively, with detailed identification of anatomical structures in different zones of liver lobules.
The qFibrosis® index provides a continuous value with open-ended ranges, where higher values indicate more severe fibrosis. These continuous values can be translated into categorical qFibrosis stages/scores based on pre-determined cut-off values determined using Youden’s index.43 qFibrosis® has been shown to strongly correlate with the current (nonalcoholic steatohepatitis clinical research network) NASH CRN fibrosis scoring system (R = 0.776, p < 0.001), demonstrating the capability to accurately differentiate between fibrosis stages with an area under the curve greater than 0.87.43
Recently, a different method called widefield SHG microscopy has been described, for visualization of collagen in lung tissue. It allows broader area coverage and quicker data acquisition, thereby enhancing the scalability of fibrosis evaluation.47 An important advantage of the tissue scanning performed using Genesis® 200 method, as described above, is that it provides uniformity of the scanned region of interest.
Quantification of zonal fibrosis dynamics in liver lobule
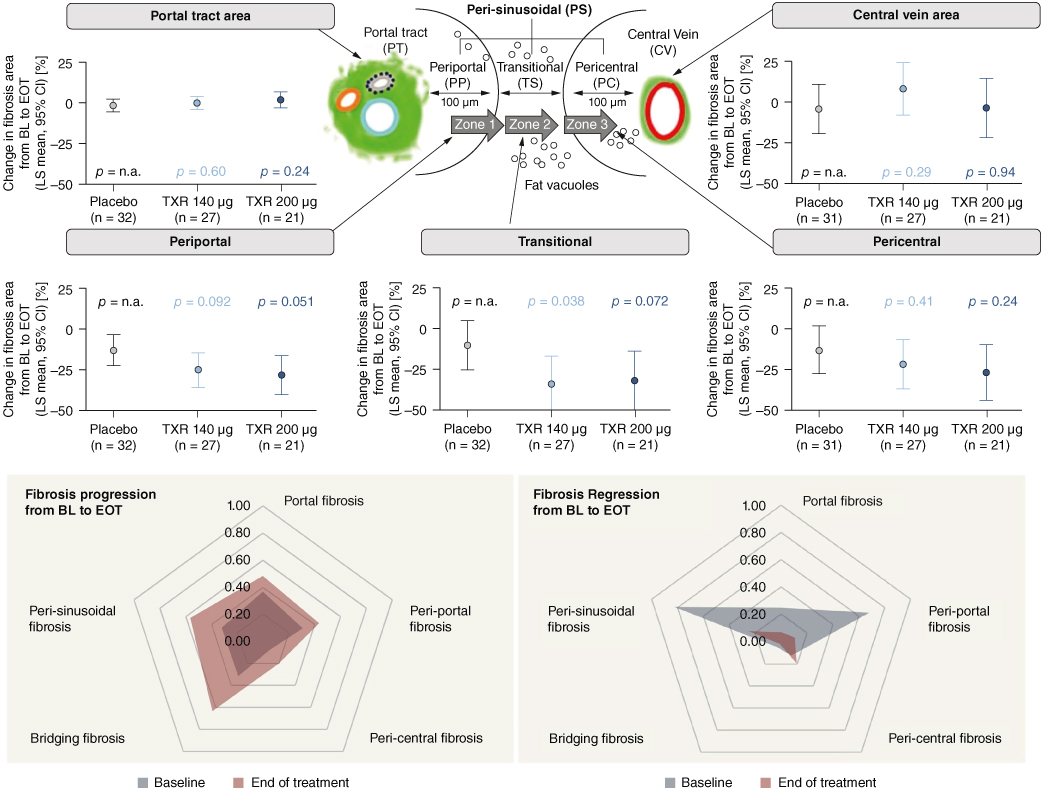
A significant advantage of the SHG/TPEF quantification approach for liver fibrosis lies in its ability to analyze collagen fiber properties within precisely defined areas of liver lobule. The overall qFibrosis calculation is derived from normalized collagen parameters, measured as units per mm2, facilitating an unbiased, highly reproducible assessment of liver fibrosis severity. Moreover, the proportion of fibrosis area, expressed as a percentage of the total fibrosis area, is determined within the five operator-defined regions of the liver lobules, as outlined above.27 Furthermore, radar maps were utilized as a novel approach for visualizing fibrosis changes in liver lobules. It displays changes in fibrosis (as determined by the mean percentage change in fibrosis area overall and in different regions) for example, from baseline to end-of-treatment in a fivedimensional map corresponding to the regions measured (Figure 2).7,48

Fibrous septa analyses
A refined classification system has been proposed to better distinguish between progressive, regressive and intermediate fibrous septa, aiming to reflect variations in septal characteristics.49 This novel septum classification not only considers the extent of collagen deposition but also features indicative of the disease’s trajectory. However, like other scorings using conventional microscopy, the definitions for different septa categories were largely descriptive and subjective.
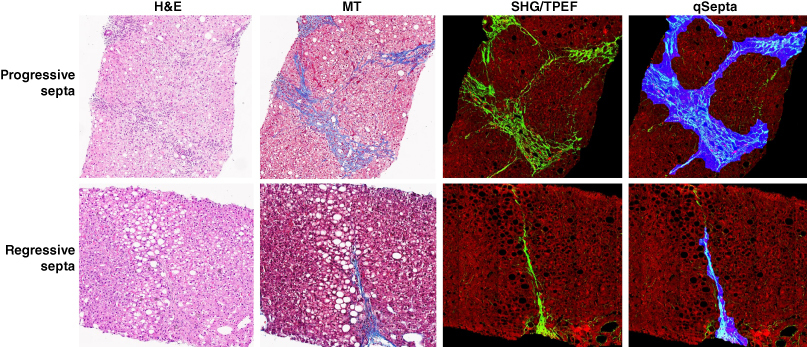
The use of SHG/TPEF methodology allows for the precise categorization of fibrous septa into progressive, regressive or intermediate septa (Figure 3). The AI-based algorithm quantitatively assesses 12 distinct septa parameters, including area, length, width, number and characteristics of collagen fibers within the septa. This methodology provides an objective means to differentiate and analyze the progressive and regressive septa in liver fibrosis.48
Moreover, this approach enables the quantification of the cellular and acellular components of fibrosis septa, as well as their alterations throughout the disease’s natural history or in response to therapeutic interventions. Utilizing AI-based software, it became possible to measure the average area of all septa in each liver specimen (i.e. total septa area normalized per number of septa) which was measured at baseline and end-of-treatment liver biopsies. These measurements are reported as a median area and range for each liver biopsy, introducing a new cumulative parameter to monitor the dynamics of septal fibrosis.48
Fibrosis assessment in cirrhosis
For the quantitative fibrosis analyses in liver specimens from patients with cirrhosis, an ML model was developed to address changes in liver architecture and its correlation with the hepatic venous portal gradient (HVPG).50 This model utilized SHG/TPEF images of unstained slides, analyzed with a digital image processing algorithm capable of quantifying: morphological characteristics of septa, including area, length and width and the collagen and cellular regions within the septal area; nodule parameters, such as number and length of nodules; 184 fibrosis parameters across various regions of liver lobule. In total, 448 criteria were quantified by the algorithm.50 The septa, nodules and fibrosis parameters were integrated to build three distinct models: SNOF (septa-nodule-fibrosis) score, correlated with HVPG, SNOF-V score – associated with the presence or development of varices, and SNOF-C score, which correlates with a change in HVPG of >20% or ≤20% between baseline and end-of-treatment, regardless of the treatment group.
qFibrosis® is superior to CPA measurement by morphometric analysis
Several morphometric image analyses have been employed for the quantitative evaluation of liver fibrosis.51–55 One such digital technique focuses on picrosirius red-stained slides, developed to provide an objective quantification of tissue collagen as CPA.39,53–55 CPA measures the area occupied by collagen (stained with the picrosirius red) as a proportion of the total surface area of the liver biopsy core section. This metric has been shown to correlate with semi-quantitative fibrosis scores and predict outcomes in patients with chronic hepatitis and cirrhosis.56,57 However, CPA measurement does not take into account the lobular architectural changes associated with vascular compromise and structural remodeling during fibrosis, necessitating a pathologist interpretation.1 Additionally, CPA measurement has limitations due to the variability of picrosirius red staining and the need for manual image curation.39,58 Furthermore, the morphometry analysis of CPA lacks AI or ML methodologies, limiting its ability to provide information beyond those visible to the human eye.30
The growing evidence demonstrates that quantitative fibrosis assessment using SHG-microscopy with AI analyses should be considered as the new standard for measuring liver fibrosis.58 The SHG methodology offers several advantages over traditional morphometric analyses as it is standardized and reproducible, offers greater sensitivity and granularity, eliminates variability associated with picrosirius red or other staining methods, and reveals changes in the nano-architecture of collagen fibers and other details not discernible by the human eye. Importantly, the role of the liver pathologist remains central in ensuring the quality of tissue and machine output is maintained, detecting potentially important biopsy information relevant to diagnosis and activity.1,58
Application of SHG in MASH clinical trials
SHG improves pathologists’ concordance
The severity of liver fibrosis is a key determinant of clinical outcomes and mortality in patients with MASH, serving as a key primary end point in MASH trials for conditional drug approval.59 However, a major challenge in drug development for MASH lies in the substantial variability of fibrosis assessment by conventional microscopy using ordinal scoring systems such as the NASH CRN system.60 There is a pressing need for tools that can assist pathologists for reliable and reproducible identification and quantification of histological changes in MASH liver biopsies.30,60 Another challenge in assessing fibrosis changes in MASH trials is the simultaneous occurrence of fibrosis progression and treatment-induced fibrosis regression, which cannot be accurately captured by ordinal systems like NASH CRN.30
SHG/TPEF microscopy with AI has proved that it can overcome these challenges and an increasing number of clinical trials have adopted this methodology for assessing fibrosis changes and treatment response.27,61–65 qFibrosis®, when utilized both as a continuous value and converted to a categorical score, has demonstrated the ability to detect treatment effects not identified with conventional NASH CRN fibrosis scoring.27,62 An AI-assistive tool, qFibrosis® improves interpathologist agreement to near-perfect levels, with a 93% agreement and 95% retention rate among pathologists with varying experience.66 Tools like qFibrosis® not only standardize pathologic assessment but could also play a crucial role in determining subject eligibility and assessing treatment effects in MASH clinical trials.
A recent prospective study employing a cross-over modality design to validate qFibrosis’ utility as an aid for pathologist assessment of fibrosis showed that qFibrosis-assisted reads significantly improve interobserver kappa for fibrosis staging, notably within the F0-F2 population. In the context of MASH clinical trials, this kappa improvement could reduce the need for third-reader adjudication by 30%.67 The study also highlighted qFibrosis’s role in enhancing concordance rates among four pathologists for inclusion of MASH with F2-F3 fibrosis stage, exclusion of MASH (F0, F1, F4 stage), and assessment of fibrosis response. The improvement in agreement, particularly in borderline cases, would have similarly reduced the adjudication necessity by 30%.67 Additionally, incorporating SHG as an assistive tool for pathologists can also reduce the high screen failure rate observed in MASH trials by offering a more sensitive and consistent assessment of milder fibrosis stages, such as F1-F2.68
Greater granularity and more information in assessing fibrosis dynamics compared with conventional microscopy
The enhanced sensitivity of SHG/TPEF evaluation of liver fibrosis enables the objective detection of changes within the 48- to 72-week timeframes typical of Phase II and the initial stages of Phase III MASH trials. Recent studies have demonstrated the advantages of AI in digital pathology by revealing anti-fibrotic effects of investigational drugs that were not captured by the NASH CRN scoring system and conventional microscopy.27,61 Specifically, regressive changes in septa morphology and collagen fiber parameters were noted in patients with F3 fibrosis, who were previously categorized as ‘unchanged’ by conventional scoring, thereby revealing greater detail and granularity.48
Furthermore, SHG provides novel insights into the pathogenesis of fibrosis regression, particularly in the perisinusoidal area.27 Contrary to the sequential progression of fibrosis stages outlined by the NASH CRN staging – from an initial ‘chicken-wire’ pattern in the perisinusoidal areas (F1), to perisinusoidal plus portal fibrosis (F2) and then to bridging fibrosis (F3) – the SHG data revealed significant fibrosis regression initially in the perisinusoidal areas, in response to decreased fat and lipotoxic drivers in hepatocytes, which subsequently extends to portal fibrosis, suggesting a general response to treatment with anti-metabolic drugs.27,62
These observations align with findings from a recent preclinical study, which showed progressive changes in multiple qFibrosis parameters following a high-fat sugar-water diet for 40–52 weeks in DIAMOND mice. Notably, fibrosis regression was observed upon diet reversal, even when a full stage of fibrosis regression, based on the ordinal NASH CRN scoring, was not evident.44 The link between fibrosis progression with high fat and sugar intake, and regression upon removal of these etiological factors supports the reliability of changes observed in qFibrosis® and septa parameters, as determined by SHG microscopy, and they are indicative of fibrosis progression and regression, both in preclinical models and clinical trial settings.44
The enhanced sensitivity and reproducibility of digital fibrosis assessment also improved the scoring accuracy of liver biopsies in pediatric patients with MASH.69 In cirrhotic patients, ML algorithm has accurately extrapolated HVPG, clinically significant portal hypertension, its changes and the development of varices from liver histology.50 The integration of SHG-derived scores – SNOF for HVPG correlation; SNOF-V for varices presence and SNOF-C for clinically significant HVPG changes – can be utilized in MASH cirrhosis clinical trials without the need for direct HVPG measurements. This approach potentially increases the accuracy of the efficacy end points in cirrhotic MASH trials.50
Assessment of steatosis, hepatocyte ballooning and colocalization of steatosis/fibrosis and ballooning/fibrosis
SHG/TPEF microscopy with AI analyses also quantifies liver fat content (qSteatosis®) across the entire liver specimen and has demonstrated a strong correlation (R = 0.71) with magnetic resonance imaging-PDFF assessment of steatosis.61 In addition, this methodology enables the detailed evaluation of the size and numbers of fat vacuoles in hepatocytes and their changes due to treatment.27 Precise liver fat quantification by SHG/TPEF provides an opportunity for more accurately determining fibrosis changes following treatment with potent anti-metabolic agents that significantly reduce liver fat.
Treatment of MASH with potent anti-metabolic compounds can markedly reduce liver fat content, thus altering the fibrosis quantification area. Steatosis correction has been applied during fibrosis dynamics assessment within the liver lobule to accurately quantify fibrosis changes across different liver lobule zones that may not be captured by NASH CRN scoring system.27 In MASH trials with compounds like the selective thyroid hormone receptor β-agonist (resmetirom), resmetirom-treated patients have shown significant reduction in liver volume versus placebo. In addition to drastic hepatic fat reduction of more than 60%, qFibrosis® can incorporate normalization procedures to account for hepatic fat and liver volume reduction thereby improving the detection of fibrosis changes.62,63,70 The use of steatosis and/or liver volume corrections in assessing liver histology in MASH trials is a new area where use of SHG with AI analyses suggests that these drug-induced liver fat content and liver volume reductions may impact the assessment of fibrosis. Further analyses are needed to better characterize the potential implication for drug efficacy evaluation.
Ballooned hepatocytes are a histological hallmark of hepatocyte injury in MASH. SHG/TPEF with AI analyses also enables the detection of the number of ballooned hepatocytes in the entire liver specimen, along with quantification of parameters such as the area and density of ballooned cells, and collagen fibers around ballooned cells.27,71 These parameters are normalized per tissue area, and a continuous qBallooning® value is generated using an algorithm trained by nine internationally recognized expert liver pathologists.71
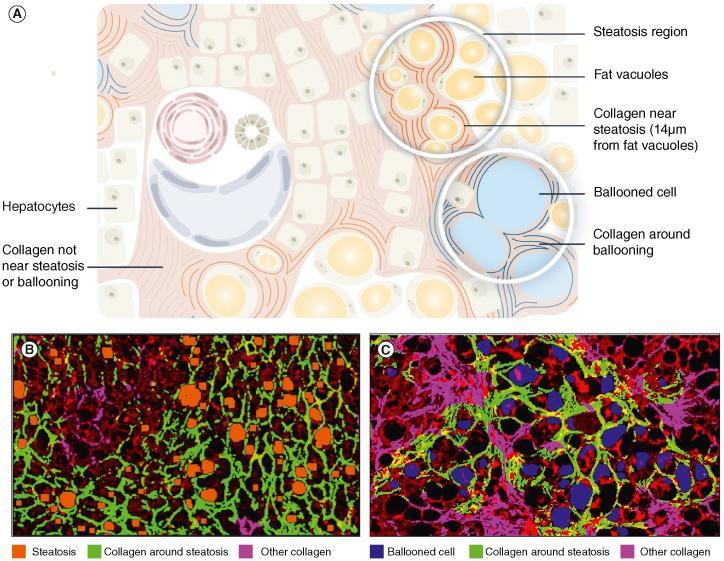
The high resolution of SHG/TPEF microscopy permits the simultaneous quantification of steatosis and nearby collagen fibers, as well as clusters of ballooned hepatocytes and its surrounding collagen fibers (Figure 4). Colocalization analyses deepen the understanding of MASH pathogenesis and the spatial relationship between liver injury, fat accumulation, ballooned cells and fibrogenesis. Such analyses were pivotal in gaining novel perspective into fibrosis regression in the perisinusoidal area27 and in evaluating the mechanism of actions of different compounds in combination therapy.65

Use of SHG in evaluating drug efficacy of combination therapies for MASH
In trials evaluating combination therapy for MASH, digital pathology plays an important role by providing detailed information on drug-induced fibrosis changes which is essential for developing and evaluating drug efficacy. For instance, the TANDEM trial, which investigated a combination therapy of a farnesoid X receptor agonist (tropifexor) and an anti-inflammatory compound (cenicriviroc, CVC), qFibrosis® analyses provided additional insights into fibrosis changes.65 Although conventional microscopy did not reveal any significant differences in liver fibrosis stages across the four treatment arms, qFibrosis® quantification across different liver lobule zones revealed that the tropifexor and CVC combination had an additive effect. This combination resulted in substantial fibrosis reduction near the areas of steatosis in all three zones of the liver lobule compared with monotherapy groups. These digital data could also be visualized with radar maps, highlighting the multidimensional changes of fibrosis within the liver biopsy.7
Employing SHG with AI analyses in combination trials for MASH could provide invaluable insights into the mechanisms of action of the different components. Its greater granularity allows for a detailed evaluation of each compound’s contribution to the combination. Furthermore, the sensitive detection of fibrosis changes in early-stage Phase II trials can aid in efficacy and dose-response assessments or facilitate go/no-go decisions for moving forward to more advanced trials of the combination regimens.
qFibrosis® parameters and relation to clinical outcomes
Although it is increasingly recognized that digital pathology with AI analysis provides enhanced granularity and sensitivity in assessing liver histology changes, establishing the clinical relevance of changes in digital parameters is essential.30 It is crucial for fibrosis scores to accurately reflect both progression and regression of fibrosis.
A recent study from the University of Edinburgh using liver biopsy material with linked long-term clinical outcome data from SteatoSITE has elucidated the relationship between SHG-derived qFibrosis® parameters and clinical outcomes.72 The authors developed individual risk indices that directly predict hard end points in patients with metabolic dysfunction-associated steatotic liver disease and do not rely on ordinal fibrosis scores as a surrogate. These tools were found to have greater predictive value than pathologist-assigned NASH CRN fibrosis stage. Ongoing studies in longitudinal cohorts aim to further analyze and validate the utilization of key qFibrosis® parameters in predicting clinical outcome and mortality.
In summary, SHG microscopy together with AI algorithms offers a sensitive and precise quantification of fibrosis dynamics across different zones of the liver lobule. The greater granularity has broadened our current knowledge of MASH pathobiology by revealing: the initiation of fibrosis regression from the perisinusoidal area, fibrosis progression or regression in patients previously categorized as ‘unchanged’ in F3 or F4 stage according to the NASH CRN scoring system and mechanistic details in evaluating treatment responses.
SHG analyses of liver fibrosis in other liver diseases
SHG microscopy has been applied to evaluate fibrosis characteristics and changes after antiviral therapy in patients with chronic hepatitis B.73,74 A comparison between the ordinal Ishak fibrosis scoring, which defined six fibrosis stages, and qFibrosis® in chronic hepatitis B patients with paired liver biopsies before and after 78 weeks of antiviral therapy highlighted SHG’s greater granularity in detecting fibrosis changes. Patients diagnosed with ‘no change’ in the Ishak stage were further categorized by qFibrosis® into three subgroups: ‘Regression by qFibrosis’ (47.6%), stable (34.5%) and ‘Progression by qFibrosis’(17.9%).73 Effective viral suppression led to fibrosis improvement, with SHG providing precise quantification of septal area and width as key histological features of liver fibrosis changes post-antiviral treatment. Importantly, the use of SHG microscopy and qFibrosis® represents a valuable tool in multicenter clinical trials for its standardized and highly reproducible fibrosis assessments.74
In liver tumor evaluation, SHG microscopy has elucidated unique details by quantifying the tumor’s 3D structural collagen framework, fibrosis amount, collagen features in the peritumor liver tissue, impacting disease prognosis. SHG/TPEF microscopy with AI analyses of the fibrotic status of the peri-tumor liver tissue identified a high-risk subgroup for hepatocellular carcinoma (HCC) recurrence post-curative resection.75 qFibrosis® could predict early HCC recurrence post-liver resection in patients with hepatitis B virus or hepatitis C virus. The fibrosis patterns in liver tissue may differ between viral and nonviral-related HCC patients, and treatment response to checkpoint inhibitors is known to vary between HCC related to MASH or viral hepatitis, highlighting an area for future research. A study of 198 patients with liver resection for HCC investigating the stromal remodeling in tumor microenvironment, collagen realignment and features of collagen fibers revealed that qFibrosis® could predict clinical outcomes such as development of portal vein thrombosis and metastasis development during follow-up after radical treatment.76
Intrahepatic cholangiocarcinoma (iCC), the second most frequent primary liver malignancy, is characterized by the presence of a desmoplastic stroma. A multimodal approach combining morphological, immunophenotypical and SHG microscopy analysis was applied to determine the amount and the 3D structural network of the desmoplastic stroma in 49 resected iCCs.77 This analysis identified two iCC types, of these the one with more fibrous and less cellular type was associated with better outcomes. In addition, the use of SHG revealed that the patients with tumor displaying high degree of collagen cross-linking had a worse prognosis. Significantly, the high proportionated stromal area was inversely correlated with vascular invasion (62.5 vs 95.7%, p = 0.006) and positively correlated with well-differentiated grade (60 vs 12.5%, p = 0.001). Patients with high proportionated stromal area had a better disease-free survival than patients with low stromal area.77
In preclinical models of liver fibrosis induced by chemical treatment with thioacetamide, or carbon tetrachloride, or after bile duct ligation, SHG/TPEF microscopy with AI provided superior and more informative results than Ishak staging scores or CPA quantification after picrosirius red staining.78
Assessing fibrosis in other organs using SHG
The presence and burden of interstitial fibrosis in kidneys is an important predictor of renal failure in various chronic renal diseases. SHG microscopy showed high accuracy in the quantification plus providing 3D imaging of interstitial renal fibrosis and arterial remodeling.79,80 In particular, it has enabled the analysis of fibrillar collagen accumulation in conditions such as experimental hypertensive renal fibrosis and human chronic allograft nephropathy, allowing for precise measurement of hypertensive vascular remodeling at the micrometer scale. Furthermore, SHG microscopy enhanced the characterization of hypertensive renal fibrosis induced by angiotensin II in mice, revealing the spatio-temporal progression of fibrosis across different renal compartments.79 In donor kidney classification, SHG was applied for the quantification of renal interstitial fibrosis in preimplantation kidney biopsies, determining the amount and 3D features of interstitial fibrosis.81 In clear cell renal cell carcinoma (ccRCC), the precise quantification of renal fibrosis was analyzed in relation to the clinical and pathological characteristics and prognosis. In this study, SHG/TPEF evaluated intratumoral fibrosis, pseudo-capsule (PC) fibrosis and adjacent normal renal interstitial fibrosis in 73 ccRCC specimen pairs. A significant decrease in progression-free survival was observed for patients with higher PC CPA compared with those with lower PC CPA (p < 0.05). The data suggest that intratumoral fibrosis and PC fibrosis are associated with ccRCC progression. In addition, PC fibrosis may act as a marker of PC invasion and an effective quantitative measurement for assessing prognosis.82
The spatial arrangements of ECM components in their native environment in lung alveoli, and their structural 3D remodeling in different lung diseases (e.g., chronic obstructive pulmonary disease, interstitial pulmonary fibrosis, pulmonary arterial hypertension-associated fibrosis, post-transplant changes in lung graft or lung cancer) could be mapped and quantified without exogenous fluorescent labels, which may be crucial for comprehensive tissue analysis.47,83 SHG probes collagen and elastin in the ECM and reveals marked changes in the collagen macro/supramolecular structure in the abnormal fibrotic collagen, which could serve as biomarkers for IPF diagnosis and progression. These changes could help in improving diagnosis or better prognosis assessment of interstitial lung diseases (e.g., idiopathic fibrosis), as well as understanding the disease pathogenesis and progression.84,85 Furthermore, SHG could also help in distinguishing between treatable and intractable pulmonary fibroses (e.g., cryptogenic organizing pneumonia vs usual interstitial pneumonia).86
Several studies have indicated that SHG microscopy is a valuable approach for quantitative assessment of skin collagen.41,87–89 Combining SHG and THG microscopy allowed imaging skin in vivo for assessing morphological changes due to aging, or for noninvasive analysis of skin cancer biopsies.41 Furthermore, SHG images allowed discriminating collagen features in abnormal versus normal skin scars87; objective identification of histological changes and more accurate classification of atopic dermatitis88; as well as quantitative insights into collagen fiber structure and changes with skin aging.89
SHG imaging has proved useful for characterizing collagen features in bone, ovarian cancers and in studies of cardiomyopathies, using human tissue and/or animal models.90–92
Collagen is a major structural ECM component in different cancers, acting both as a barrier against cancer cell migration and facilitating metastasis when stromal collagen increases. Several studies have demonstrated the diagnostic benefits of using SHG microscopy to analyze stromal organization and its impact on invasion and metastasis of breast and ovarian cancers.93–97 The SHG-determined tumor-associated collagen signature was suggested as a new biomarker which is significantly associated with the long-term survival of patients with breast cancer and could be used as an adjunct to the routine histological evaluation to inform patient diagnosis.93 The assessment of intertumoral collagen by SHG imaging was shown to be of prognostic value, especially in the luminal subtype breast cancer.94
Interestingly, SHG microscopy’s ability to quantify collagen subtypes, particularly types I and III, has provided additional information into breast and ovarian cancers.96,97 In ovarian cancer, the upregulation of the minor isoform of collagen III in invasive disease and the differentiation between collagens I and III in self-assembled gels underscores the clinical significance of understanding the collagens I/III balance changes in disease progression.97
Conclusion and future perspective
Fibrosis assessment in chronic diseases is central in diagnostic pathology, evaluation of treatment response and prognosis. SHG/TPEF microscopy accompanied by AI analyses has shown unparalleled precision in quantifying tissue collagen in its natural unstained environment. It allows analyses of the 3D structure and features of fine collagen fibers in both normal and malignant tissues, and uncovering fibrosis dynamics beyond the capabilities of the human eye. The SHG microscopy provides new insights into the balance between fibrogenesis and fibrolysis, with greater granularity and sensitivity in tracking disease evolution, treatment outcomes, plus identifying novel mechanism-of-action specific patterns of response to therapies. Today, the SHG/TPEF microscopy with AI provides an invaluable aiding tool to pathologists in achieving standardized, detailed quantification and comprehensive analyses of collagen deposition across various diseases, ultimately allowing to break away from the currently used subjective staging of fibrosis burden (Figure 5). Initial results of SHG application in liver diseases, and MASH in particular, demonstrate that the SHG-determined fibrosis parameters correlate with clinical outcomes, which is further investigated in ongoing studies with large longitudinal cohorts. Upon full validation in the near future, it is expected that SHG/AI assessment of fibrosis will re-define the end points in MASH clinical trials and be able to better predict clinical events such as liver failure, the need for liver transplantation, development of hepatocellular carcinoma and survival and facilitating drug development. This assessment will still be done under the supervision of pathologists, as the new technologies are aiming to complement and enhance human resources rather than replacing them, both in chronic diseases as well as in oncology. Classification of breast cancer into subtypes or prostate cancer diagnosis involving digital pathology represent examples for successful implementation of ML approaches into clinical setting. Looking ahead, the benefits of SHG microscopy investigation of tissue fibrosis will be even greater as part of complex evaluations and multimodal analyses including histology, imaging, -omics methodologies and serum biomarkers. Together with AI applications, this approach promises to deliver personalized disease assessments, comprehensive predictions of therapy outcomes and prognosis in chronic diseases and in oncology.

Summary points
-
Digital pathology represents one of the most promising avenues for diagnostic medicine, aiming to deliver faster, more efficient and accurate diagnosis, phenotypic characterization and outcome prediction in cancer and other diseases.
-
Digital pathology extends the information obtained from the traditional pathology because of improved sensitivity, precision, standardization and the ability of handling large and complex data sets.
-
Second harmonic generation (SHG)/two photon excitation fluorescence) digital pathology with integrated AI analyses has shown unparalleled precision in quantifying tissue collagen in its natural unstained environment.
-
It allows analyses of the 3D structure and features of collagen fibers in both normal and malignant tissues, and uncovering fibrosis dynamics beyond the capabilities of the human eye.
-
Leveraging the principles of SHG microscopy, a highly sensitive system for quantification and AI analyses of liver fibrosis has been developed and expressed as a continuous qFibrosis® index.
-
This approach provides high sensitivity and granularity in analyzing liver fibrosis in different areas of liver lobule, quantitative differentiation between progressive and regressive fibrous septa and colocalization analyses of fibrosis/steatosis and fibrosis/ballooned hepatocytes.
-
The use of SHG digital pathology in clinical trials for metabolic dysfunction-associated steatohepatitis was shown to overcome current challenges in assessment of liver histology by improving the concordance rates between pathologists, along with increased information and granularity in assessing fibrosis dynamics compared with conventional microscopy.
-
Ongoing studies involving large prospective and/or retrospective cohorts of patients with metabolic dysfunction-associated steatotic liver disease will determine the clinical relevance and prognostic significance of changes in digital fibrosis parameters.
-
SHG microscopy was shown to elucidate unique details of 3D structural collagen framework, fibrosis amount, collagen features in liver, breast or ovarian cancers, thus providing new biomarkers for differentiation of different subtypes, inform patient diagnosis and treatment response and/or be of prognostic value.
-
In future, the benefits of SHG microscopy investigation of tissue fibrosis will be even greater as part of complex evaluations and multimodal analyses including histology, imaging, -omics methodologies and serum biomarkers in chronic diseases and in oncology.
Author contributions
Both authors contributed in the design, data analysis and writing of the manuscript.
Acknowledgements
The authors would like to thank Y Tay (Histoindex Pte. Ltd., Singapore) for the artwork and figures. L Untwal (Textometry Pvt. Ltd., India) provided editorial and formatting support for this manuscript in accordance to GPP 2022 (https://www.ismpp.org/gpp-2022).
Financial disclosure
NV Naoumov is advisor to HistoIndex Pte. Ltd. and a member of the Scientific Advisory Board for InSphero. E Chng is an employee of HistoIndex Pte. Ltd.
Information pertaining to writing assistance
The manuscript was designed and written entirely by the two authors. L Untwal (Textometry Pvt. Ltd., India) provided editorial and formatting support for the manuscript in accordance to GPP 2022 (https://www.ismpp.org/gpp-2022).
Ethical disclosure
This is a review article and did not require any approvals from institutional review board or other ethics committee. Authors take complete responsibility of ethical conduct for development of this review article.
Data sharing statement
All the data that support the findings from the studies included in this review article are the property of respective organizations. Data can be made available for collaborative investigations upon request with an appropriate institutional collaboration agreement.